MORNITORING POP IN COASTAL VIETNAM AND SOME RESULTS OF POLYCHLORINATEDBIPHENYL (PCBs) POLLUTION STATUS IN THE NORTHEAST COASTAL REGION AND RED RIVER DELTA, VIETNAM
Duong Thanh Nghi1) , Tran Duc Thanh1) , Do Quang Huy2)
1) Institute of Marine Environment and Resources-VAST;
2) Hanoi University of Science, VNU Hanoi
ABSTRACT: The persistence organic pollutants of PCB group (28, 52, 101, 138, 153, 180) were determined in three coastal environment components including water, sediments and tissues of Clam (Meretrix lyrata) in the Northeast area and Red River delta. The samples were collected in March and August, 2012. The results showed that the PCBs were appearing in all water, sediments and tissues of Clam with the concentrations 719.46 – 792.11 ng/L; 9.83 – 14.97 ng/g; 39.79 – 40.30 ng/g respectively, and lower than environmental standards. The distribution of total PCBs in the three environmental components were varied by the seasons and space. They were an inversive relationship of PCBs in the coastal water- sediment environment and tissues of Clam in Northeast area, meanwhile ambient relationship in Red River delta. The bioaccumulation factor (BAF) of the total PCBs for Clam tissue was in the range from 7.46 to 56.42, higher in Red River delta, and lower in Northeast area in both rainy and dry seasons.
Keywords: POPs, PCBs, bio-accumulation, coastal area, Northeast Vietnam.
I. Introduction
There are 14 monitoring stations along the coastal Vietnam, which are: Tra Co, Ha Long, Do Son, Ba Lat, Sam Son, Cua Lo; Quang Phu, Con Co, Son Tra, Dung Quat, Quy Nhon; Nha Trang, Ganh Rai, Rach Gia (figure 1). The organic chlorinated pesticides have been observed since 1996, and the polychlorinated biphenyls have been monitored since 2010. However, the congeners in POPs, which have been monitored, are not synchronization among water, sediment, tissue, and stations in comparison. That affects on monitoring and evaluation of pollution levels of POP, and of the accumulation POPs from the environment into the organism, as well as potential impacts to human health. To overcome limitations, to build a unified POP monitoring program in the environment of coastal part.
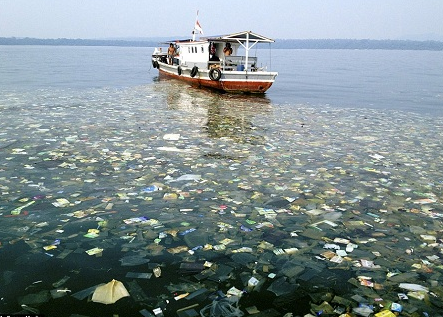
Vietnam participated in the Stockholm Convention on 22 of July 2002, research has managed to use and commitment gradually eliminate the persistent organic pollutants (POPs) from the environment by toxic carcinogen and its genetic mutation. Vietnam does not produce PCBs but used in the imported industrial and power sector equipments. Currently, the amount of PCBs in Vietnam is huge, according to some surveys, it could be up to 20,000 tons. Accordingly, Vietnam Electricity Corporation is organization are managing the most amount of electrical equipment (production and transmission). Initial statistics show that this organization is currently managing over 60% of total PCB in Vietnam. Specifically, approximately 9,000 tonnes of PCB oil, and 1,000 tons of PCB oil in suspected electrical system. In addition, there exists a PCB volume of industrial devices outside the power sector has not been pinpointed [7]. Coastal is last place receiving pollutants, including PCBs from the river basin water stream flowing into the sea, and the redistribution of the components of water, sediments and biota. The findings of this paper on PCBs pollution in coastal environments and the ability to accumulate PCBs in clam tissues through bioaccumulative factor (BAF) contributes into management and prevention works effectives of POPs / PCBs to health and human ecology.
- Materials and Methods
2.1. the area of sampling and study
The samples of water, sediment and clam tissue was collected at the same time in two field campaigns: in March (dry season) and in August (rainy season) 2012. The monitoring station system was set up in the northern coastal Vietnam from Mong Cai to Ninh Binh. Its divided into two natural regions: The northeastern coastal and red river delta. (figure 2).
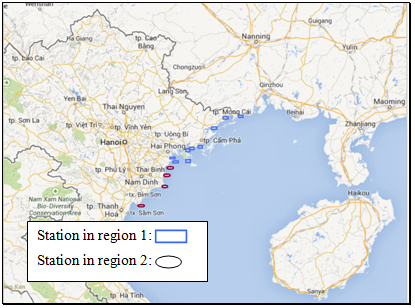
Figure 2. Survey Stations System.
2.2. The sample collection and preservation
Take water samples at 0.5 – 0,7 m depth by Niskin (PWS) equipments and contain in dark colored glass bottle. Sediments are scooped by crab hoe Pornar and take it around 0 – 5 cm depth from surface in to dark colored glass bottle. Catch clam (Meretrix lyrata) by bottom scratch net, and collect ones with long, wide, thick size around 2,6 – 5,8 cm, 1,0 – 5,1 cm and 0,6 – 3,3 cm respectively, and wrap clam sample in cleaned aluminum paper. All collected sample are maintained in box at temperature 0 – 40C condition. [2, 5, 6]
2.3. Sample treatment and analysis
2.3.1. Extract PCBs from collected samples
Water sample: extract PCBs in 1 L of water sample three time by 50ml pure n-hexan solvent, reduce the solution with extracted PCB to about 5 mL by system vacuum and heated evaporating rotation divide, the solution samples are clean up through 2 g silicagel in glass column, elute PCBs form this column with 45 mL pure n-hexan; reduce the PCB sample solution volume into around 0,5 mL by the same divide; add internal standard and compensate volume till 1 ml by pure n-hexan [4]. Sediment sample: Use ultrasonic bath to extract 20g sediment sample three times with mix solvent n-hexan/axeton (1:1, v/v) and sulfur treatment by pure copper powder; centrifugal, enrich the PCB in sediment sample solution by vacuum and heated evaporating rotation divide to volume around 5 mL; clean up and separate PCBs from solution by 2 g silicagel in glass column with 3×15 mL n-hexan; evaporate the eluting solution till volume 0,5 mL; add internal standard and compensate volume till 1 ml by pure n-hexan [5]. Clam tissue sample: Homogeneous clam tissue sample is extracted the same sediment, and remove water in sample solution by dry Na2SO4. Evaporating rotation by vacuum and heat condition to 5 mL; clean up and separate PCBs from clam tissue sample solution as the same with sediment sample [6, 7].
2.3.2. Sample analysis
Use the instrument gas chromatography connected with electronic capture detector of Agilent 6890, to determine PCB constituents. The running condition of GC-ECD instrument is set up: Temperature program oven: 800C, 1 minute, 200C/minute rate 1, 2500C, 50C/minute rate 2, 2900C, 5 minutes. Total time 22,5 minute; the carry flow of N2 is 0,9 mL/s with flow split 1:28; the capillary column HP1 (30m x 0,32mm x 0,25mm) and detector mode 2900C. the standard correlation base on concentrations: 15 ng/mL, 30 ng/mL, 60 ng/mL, 90 ng/mL. Analyze standard solution with the same condition in above at item 2.3.1.
2.3.3. Calculate analysis results
To calcutate concentration of PCB with equation with coefficient (R2) > 0,99. Total PCB concentration is equally A x ∑PCB (PCB28 + PCB52 + PCB101 + PCB138 + PCB153 + PCB180); therein, A factor has value in range 3 – 8,5 according to each mixed Aroclor [4,8].
BAF – Bioaccumulation Factor with PCBs is calculated in some publication journals [6, 8, 10]. Whereby:
BAF = (BA)/(ECf),
BA: Concentration of PCBs in tissue (ng/kg wet sample).
ECf: Concentration of PCBs in water sample where organisms living in (ng/l).
III. Results and discussion
3.1. The environmental characteristics of two regions
There are not any rain or storm in both two field campaign. The temperature of atmosphere is range 16,100C – 22,700C in dry season and 25,700C – 32,700C in rainy season and its tend rises from coastal Mong Cai to coastal Ninh Binh.
The physical environment condition in survey region is described in table 1 below. Wherein, the region 1 has temperature and salinity fluctuation around 17,25 – 33,23 0C; 10,00 – 31,50‰ respectively. The region 2 has temperature and salinity in range 19,05 – 30,45 0C; 10,00 – 30,45‰ respectively. The temperature and salinity in region 2 are lower than region 1 because there are many river mouths of Red river system here. The physical environment condition is different between region 1 and region 2 lead to the difference in PCBs distribution in two region.
Table 1. Physical environment conditions at sampling locations in northeast coastal Vietnam
| Or. | Region | Stations | Symbols | Coordinates | Temprature
(0C) |
Salinity
(‰) |
|
| latitude | logitude | ||||||
| 1 | The coastal North -eastern (Region 1)
|
Tra Co | ĐB1 | 21025’50’’ | 108001’58’’ | 18,21 – 28,13 | 20,50 – 25,50 |
| 2 | Dan Tien | ĐB2 | 19058’37’’ | 106008’48’’ | 18,20 – 28,00 | 10,50 – 25,50 | |
| 3 | Tien Yen | ĐB3 | 20014’08’’ | 106034’19’’ | 17,80 – 28,15 | 10,00 – 30,00 | |
| 4 | Bai Chay | ĐB4 | 20057’00’’ | 107003’30’’ | 18,01 – 30,59 | 25,30 – 30,00 | |
| 5 | Ha Long | ĐB5 | 20035’36’’ | 106037’10’’ | 17,25 – 30,60 | 11,00 – 31,50 | |
| 6 | Cat Ba | ĐB6 | 20047’126’’ | 106’50’’742’’ | 18,25 – 32,31 | 25,00 – 31,00 | |
| 7 | Bach Dang | ĐB7 | 20047’126’’ | 106050’742’’ | 19,01- 33,23 | 10,00 – 25,00 | |
| 8 | Cua Tray | ĐB8 | 20049’10’’ | 106045’40’’ | 17,40 – 31,40 | 10,00 – 15,50 | |
| 9 | Do Son | ĐB9 | 20043’00’’ | 106050’00’’ | 18,22 – 32,53 | 20,00 – 30,50 | |
| 1 | The Red river delta (Region 2) | Cua Van Uc | SH1 | 20059’40’’ | 106004’10’’ | 19,05 – 30,45 | >1,00 – 10,00 |
| 2 | Cua Thai Binh | SH2 | 20059’42’’ | 106004’17’’ | 20,70 – 28,55 | >1,00 – 8,50 | |
| 3 | Cua Ba Lat | SH3 | 21018’29’’ | 107035’38’’ | 21,30 – 27,50 | 7,00 – 19,00 | |
| 4 | Cua Day | SH4 | 21030’23’’ | 107053’04’’ | 19,85 – 28,60 | 7,50 – 11,50 | |
3.2. The total amount of PCBs in the study samples
The total amount of PCBs in region 1: PCBs have been found in sample of both dry and rainy season. In water sample, total PCBs concentration is from 644,76 ng/l to 939,46 ng/l and the PCBs concentration in dry season is 1,46 times higher than in rainy season. Total PCBs concentration in sediment sample is in range 8,01 – 11,64 ng/g dry and all is below limitation of Vietnamese regulations QCVN43: 2012/BTNMT [1]. Total PCBs concentration in clam tissue sample is from 23,71 ng/g dry to 55,86 ng/g dry, is under permission of US Food and Drug Administration (FDA US, sea foods < 2 ppm). [9]
The total amount of PCBs in region 2: PCBs appeared in samples of dry and rainy survey campaigns. Total PCBs concentration in water sample is around 133,75 – 1305,18 ng/l, the PCBs concentration in rainy season is 9,75 times higher than dry season. Total PCBs concentration in sediment sample is from 3,39 to 26,55 ng/g dry and it is under limitation of Vietnamese regulations QCVN 43:2012/BTNMT [1]. Total PCBs concentration in clam tissue sample is around 31,60 – 49,01 ng/g dry, it is under US limitation of regulations. [9]
3.3. The PCBs concentration in each coastal component
Because PCBs always appear in sea water sample and varies according to seasonal and geographical features so study region have been received sources of PCBs wastes. Some chemical compounds contained PCBs have been banned to use in development countries from 1970s, but in Vietnam it is still using and replace gradually in electrical sector for instance, so the source of PCBs wastes is existing. According to season, the total PCBs concentration in dry is higher than rainy in region 1, but in region 2 is reversed. Total PCBs concentration in water sample of region 1 is 1,1 times higher than region 2 (table 2).
Table 2. The seasonal fluctuation of PCB concentration in coastal water
| Coastal | Season | Unit | PCB 28 | PCB 52 | PCB 101 | PCB 153 | PCB 138 | PCB 180 | ∑6 PCB | Total PCBs |
| Region 1 | Dry | ng/L | 11,14 | 127,22 | 0,74 | 0,49 | 0,27 | 1,26 | 133,88 | 939,46 |
| Rainy | ng/L | 31,59 | 59,17 | 6,24 | 2,54 | 20,88 | 2,94 | 99,74 | 644,76 | |
| Average1 | ng/L | 21,37 | 93,20 | 3,49 | 1,51 | 10,57 | 2,10 | 116,81 | 792,11 | |
| Region 2 | Dry | ng/L | 8,71 | 10,87 | 6,52 | 1,76 | 0,12 | 0,84 | 19,87 | 133,75 |
| Rainy | ng/L | 26,72 | 123,45 | 9,39 | 8,32 | 32,05 | 2,07 | 194,45 | 1.305,18 | |
| Average2 | ng/L | 17,71 | 67,16 | 7,95 | 5,04 | 16,08 | 1,45 | 107,16 | 719,46 |
The PCB accumulation in sediment is different from PCB concentration in water. The distribution and accumulation of PCB in sediment depend on deposition processing of suspended matter and diffusion of soluble forms in each region. In region 1, PCBs concentration in dry season is higher than in rainy season sediment corresponding to water environment. In region 2 is different from region 1, PCBs concentration in dry season is lower than in rainy season sediment cause coastal current and topographic shoreline. Total PCBs concentration in sediment region 2 is 1,52 time higher than region 1, these results are showed in table below (table 3).
Table 3. The seasonal fluctuation of PCB concentration in coastal sediment
| Coastal | Season | Unit | PCB 28 | PCB 52 | PCB 101 | PCB 153 | PCB 138 | PCB 180 | ∑6 PCB | Total PCBs |
| Region 1 | Dry | ng/g dry | 0,40 | 1,08 | 0,08 | 0,19 | 0,08 | 0,16 | 1,76 | 11,64 |
| Rainy | ng/g dry | 0,12 | 0,69 | 0,51 | 0,04 | 0,03 | 0,04 | 1,30 | 8,01 | |
| Average1 | ng/g dry | 0,26 | 0,89 | 0,30 | 0,11 | 0,06 | 0,10 | 1,53 | 9,83 | |
| Region 2 | Dry | ng/g dry | 0,53 | 3,12 | 0,07 | 0,16 | 0,11 | 0,15 | 3,80 | 26,55 |
| Rainy | ng/g dry | 0,06 | 0,34 | 0,04 | 0,04 | 0,03 | 0,03 | 0,49 | 3,39 | |
| Average2 | ng/g dry | 0,29 | 1,73 | 0,05 | 0,10 | 0,07 | 0,09 | 2,14 | 14,97 |
Clam (Meretrix lyrata) is bivalve species living in sandy mud bottom, and filter feeding and little moved. The PCBs concentration in clam tissue vary seasonally to water and sediment environment. However, PCBs concentration accumulate in tissue depending on not only living environment but also biological features of organism. The distribution tend of accumulated PCBs in dry season clam tissue is lower than rainy season in both region 1 and 2. This finding can indicate that pollution sources of PCB are ongoing in coastal water environment (table 4).
Table 4. The seasonal fluctuation of PCB concentration in clam tissue (Meretrix Lyrata)
| Coastal | Season | Unit | PCB 28 | PCB 52 | PCB 101 | PCB 153 | PCB 138 | PCB 180 | ∑6 PCB | Total PCBs |
| Region 1 | Dry | ng/g dry | 0,79 | 2,02 | 0,26 | 0,62 | 0,24 | 0,99 | 4,18 | 23,71 |
| Rainy | ng/g dry | 0,37 | 6,36 | 1,17 | 0,21 | 0,25 | 0,59 | 8,42 | 55,86 | |
| Average1 | ng/g dry | 0,58 | 4,19 | 0,71 | 0,42 | 0,24 | 0,79 | 6,30 | 39,79 | |
| Region 2 | Dry | ng/g dry | 0,62 | 3,52 | 0,12 | 0,30 | 0,17 | 0,19 | 4,52 | 31,60 |
| Rainy | ng/g dry | 0,06 | 6,76 | 0,06 | 0,11 | 0,05 | 0,04 | 7,00 | 49,01 | |
| Average2 | ng/g dry | 0,34 | 5,14 | 0,09 | 0,21 | 0,11 | 0,11 | 5,76 | 40,30 |
The distribution ratio of PCB concentration in northeast coastal Vietnam show that the fluctuation trend of PCB concentration in natural environment and in compare with in organism tissue are not correlation. The distribution features PCB in each component are much different between water environment and organism tissue, and PCB in sediment is nearly not change according to dry and rainy season. This behavior can recognize that the stabilization of PCB concentration in sediment region 1, and the PCB concentration changing in clam tissue is little effected from natural habitat (Figure 2).
In the Red river delta coastal, the fluctuation trend of PCB concentration in natural environment is reversed in compare with northeast coastal Vietnam, the PCB concentration in clam tissue is still high. The total PCB concentration in clam tissue is correlating with PCB concentration in water environment (figure 2).
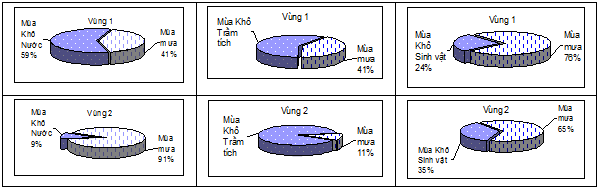
Figure 2. Fluctuation trend of PCB concentration in clam tissue and living environment
3.4. Bio accumulation factor of clam (Meretrix lyrata) with PCBs
Although the PCB concentration alternate to natural condition like current flow, topographic, deposition, erosion, accumulation…of inorganic environment, bủ BAF of clam with PCB is determined by ratio between maintained PCB concentration in tissue with in surrounding water environment. Therefore, the BAF of clam with PCB in the red river delta is higher than the northeast coastal Vietnam to point that bio-accumulation with PCB in estuaries region are higher than in gulf, bays region. The BAF average in year of clam with PCB is from 7,46 to 56,42 (Figure 3).
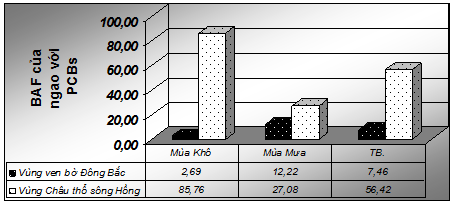
Figure 3. Bio accumulative factor of clam (Meretrix Lyrata) with PCBs in region 1 and 2
Thus, the PCB pollutants was carried to coastal region by water flow with very low concentration but the PCB concentration is redistributed and accumulated into sediment and organism tissue with many times higher level. This result shows a possibility of PCB accumulation into sediment and organism tissue. The BAF of clam with PCBs also presents the exposure of PCB in a inorganic component into organic one and damage to ecosystem and local residential through food chains. This illustration results suggest for researchers, managements in their work on prevention PCB or POP in general from the coastal environment.
IV. Conclusion:
The persistent organic polutants, PCB group, appear in three components of the northeast coastal and red river delta, which is water, sediment, and organism tissue (Meretrix Lyrata). The total PCBs concentration in these components above is 719,46 – 792,11 ng/L; 9,83 – 14,97 ng/g dry; và 39,79 – 40,30 ng/g dry, respectively. Although, PCB concentration exist in water, sediment environment and in organism tissue but PCB levels are all in the allowable limits of Vietnam regulations or US FDA (US Food and Drug Administration).
The PCB distribution and accumulation according to seasonal features, but there are some differences in each natural components and each study region. The distribution and accumulation of PCB in inorganic components (water and sediment) depend on contaminated water sources, but in biotic component ( like clam tissue) still depend on accumulation ability of organism species and persistent characteristics of pollutants like PCB. The BAF of clam with PCB is around 7,46 – 56,42; in which the BAF in red river delta region is higher than in the northeast coastal Vietnam.
Acknowledgement:
This work was completed under the financial support of the VAST project (CTG01/12-13) and the national monitoring network program 2014 (ĐTQG/IMER/VAST). The authors would like to thank those sponsors. Thanks to local departments and agencies helped us in the process of implementation of tasks.
References
- Ministry of natural resources and environment. Vietnam environment regulations 10: 2008/MONRE on the coastal water quality, 2008 and Vietnam environment regulations 43: 2012/ MONRE on sediment quality, 2012.
- Canada Environment Agency. Canadian Environmental Quality Guidelines. Summary of Existing Canadian Environmental Quality Guidelines, 2003.
- Do Quang Huy, Duong Thanh Nghi, 2001. Determine the residue of pesticides in environmental samples by gas chromatography. Journal of environment, Natural science colleges, Hanoi national university, vol 6, pages 20-25.
- Duong Thanh Nghi, Tran Duc Thanh, Tran Van Quy, Do Quang Huy. Assessment of bio- accumulation of PCBs and PAHs in Halong bay, 2011. The proceeding of 5th national conference on marine science and technology, Publishing house Natural science and techlonogy, pages 77-84.
- Duong Thanh Nghi, Do Thi Viet Huong, Nguyen Hoang Toan, Do Quang Huy, 2012. Accumlation of Polychlorinated biphenyls in the coastal estuaries in the territory of Haiphong city, Journal of Science and technology, vol 28-4s, pages 153-160.
- Duong Thanh Nghi, Tran Duc Thanh, Tran Van Quy, 2013. Phân bố và tích tụ chất ô nhiễm hữu cơ bền OCPs VÀ PCBs trong vùng biển ven bờ phía Bắc Việt Nam, Journal of marine science and technology, vol 13-1, pages 66-73.
- Pham Binh Quyen, Dang Duc Nhan, Nguyen Van San, 1995. Environmental pollution in Vietnam: analytical estimation and Environmental priorities. Trends in analystical chemistry, vol.14, no.8, pp.383-388. Elsevier Science B. V. All right reversed.
- EPA 1995. Great Lakes Water Quality Initiative technical support document for the procedure to determine bioaccumulation factors. EPA-820-8-005, NTIS PB95187290. 185pp .
- FDA 2008. Environmental Chemical Contaminant and Pesticide Tolerances, Action Levels, and Guidance Levels, 21pp.
- vietbao.vn/Kinh-te/VN-Thuy-Sy-Thoa-thuan-thai-loai-chat-doc-hai-PCB-nganh-dien/20659075/174/
Annex.
| Ordinal | District | station name | Coordinates | |
| 1 | Mong Cai | Tra Co | 21025’50’’N | 108001’58’’E |
| 2 | Quang Ninh | Ha Long | 20057’00’’N | 107003’30’’E |
| 3 | Hai Phong | Do Son | 20043’00’’N | 106050’00’’E |
| 4 | Thai Binh | Ba Lat | 20015’00’’N | 106036’00’’E |
| 5 | Thanh Hoa | Sam Son | 19043’42’’N | 103053’57’’E |
| 6 | Nghe An | Cua Lo | 18049’36’’N | 105043’00’’E |
| 7 | Quảng Binh | Quang Phu | 17°54’70’’ N | 106°34’50’’ E |
| 8 | Quang Tri | Con Co | 17°05’00” N | 107°20’00” E |
| 9 | Đa Nang | Son Tra | 16°11.90′ N | 108°15.00′ E |
| 10 | Quang Ngai | Dung Quat | 15°28’80’’ N | 108°47’60’’ E |
| 11 | Binh Đinh | Quy Nhon | 13°45.40′ N | 109°18.90′ E |
| 12 | Khanh Hoa | Nha Trang | 12o12’45”N | 109o13’12”E |
| 13 | Ba Ria Vung Tau | Ganh Rai | 10o23’27”N | 107o01’05”E |
| 14 | Kien Giang | Rach Gia | 09o58’24’’N | 105o04’07”E |
………………………………………………………………………………….
Nguồn: Trích dẫn từ kỷ yếu Hội nghị môi trường toàn quốc lần thứ IV, Bộ tài nguyên và Môi trường, Hà Nội, 29/09/2015
…………………………………………………………………………………..
Leave a Reply